The
most comprehensive study of personal wealth ever undertaken also
reports that the richest 1% of adults alone owned 40% of global assets
in the year 2000, and that the richest 10% of adults accounted for 85%
of the world total. In contrast, the bottom half of the world adult
population owned barely 1% of global wealth.
The
research finds that assets of $2,200 per adult placed a household in
the top half of the world wealth distribution in the year 2000. To be
among the richest 10% of adults in the world required $61,000 in
assets, and more than $500,000 was needed to belong to the richest 1%,
a group which Ś with 37 million members worldwide Ś is far from an
exclusive club.
The
UNU-WIDER study is the first of its kind to cover all countries in the
world and all major components of household wealth, including
financial assets and debts, land, buildings and other tangible
property.
æOne
should be clear about what is meant by ōwealthö,Æ say co-authors
James Davies of the University of Western Ontario, Anthony Shorrocks
and Susanna Sandstrom of UNU-WIDER, and Edward Wolff of New York
University. æIn everyday conversation the term ōwealthö often
signifies little more than ōmoney incomeö. On other occasions
economists use ōwealthö to refer to the value of all household
resources, including human capabilities.Æ
æWe
use the term in its long-established sense of net worth: the value of
physical and financial assets less debts. In this respect, wealth
represents the ownership of capital. Although capital is only one part
of personal resources, it is widely believed to have a
disproportionate impact on household wellbeing and economic success,
and more broadly on economic development and growth.Æ
Wealth
levels across countries
Using
currency exchange rates, global household wealth amounted to $125
trillion in the year 2000, equivalent to roughly three times the value
of total global production (GDP) or to $20,500 per person. Adjusting
for differences in the cost-of-living across nations raises the value
of wealth to $26,000 per capita when measured in terms of purchasing
power parity dollars (PPP$).
The
world map shows per capita wealth of different countries.
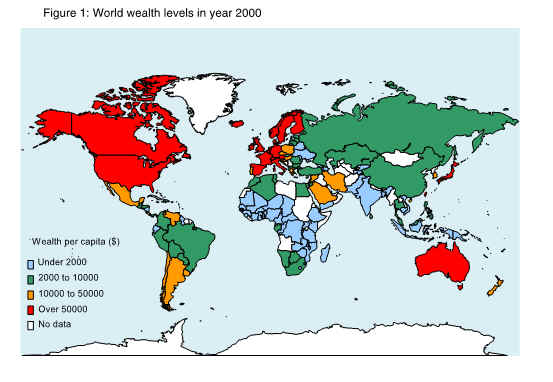 Average wealth amounted to
$144,000 per person in the USA in year 2000, and $181,000 in Japan.
Lower down among countries with wealth data are India, with per capita
assets of $1,100, and Indonesia with $1,400 per capita.
Average wealth amounted to
$144,000 per person in the USA in year 2000, and $181,000 in Japan.
Lower down among countries with wealth data are India, with per capita
assets of $1,100, and Indonesia with $1,400 per capita.
Per
capita wealth levels vary widely across countries. Even within the
group of high-income OECD nations the range includes $37,000 for New
Zealand and $70,000 for Denmark and $127,000 for the UK.
Wealth
is heavily concentrated in North America, Europe, and high income
Asia-Pacific countries. People in these countries collectively hold
almost 90% of total world wealth. (Figure 2)
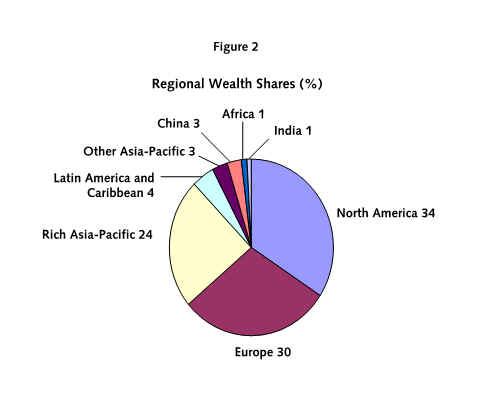
Although
North America has only 6% of the world adult population, it accounts
for 34% of household wealth. Europe and high income Asia-Pacific
countries also own disproportionate amounts of wealth. In contrast,
the overall share of wealth owned by people in Africa, China, India,
and other lower income countries in Asia is considerably less than
their population share, sometimes by a factor of more than ten.
(Figure3)
The
study finds wealth to be more unequally distributed than income across
countries. High income countries tend to have a bigger share of world
wealth than of world GDP. The reverse is true of middle- and
low-income nations. However, there are exceptions to this rule, for
example the Nordic region and transition countries like the Czech
Republic and Poland.
The
authors of the UNU-WIDER study explain that in Eastern European
countries æprivate wealth is on the rise, but has still not reached
very high levels. Assets like private pensions and life insurance are
held by relatively few households. In the Nordic countries, the social
security system provides generous public pensions that may depress
wealth accumulation.Æ
World
wealth inequality
The
concentration of wealth within countries varies significantly but is
generally high. The share of the top 10% ranges from around 40% in
China to 70% in the United States, and higher still in other
countries.
The
Gini value, which measures inequality on a scale from zero to one,
gives numbers in the range from 35% to 45% for income inequality in
most countries. In contrast, Gini values for wealth inequality are
usually between 65% and 75%, and sometimes exceed 80%.
Two
high wealth economies, Japan and the United States, show very
different patterns of wealth inequality, with Japan having a wealth
Gini of 55% and the USA a wealth Gini of around 80%.
Wealth
inequality for the world as a whole is higher still. The study
estimates that the global wealth Gini for adults is 89%. The same
degree of inequality would be obtained if one person in a group of ten
takes 99% of the total pie and the other nine share the remaining 1%.
Where
do the worldÆs wealthy live?
According
to the study, almost all of the worldÆs richest individuals live in
North America, Europe, and rich Asia-Pacific countries. Each of these
groups of countries contribute about one third of the members of the
worldÆs wealthiest 10%.
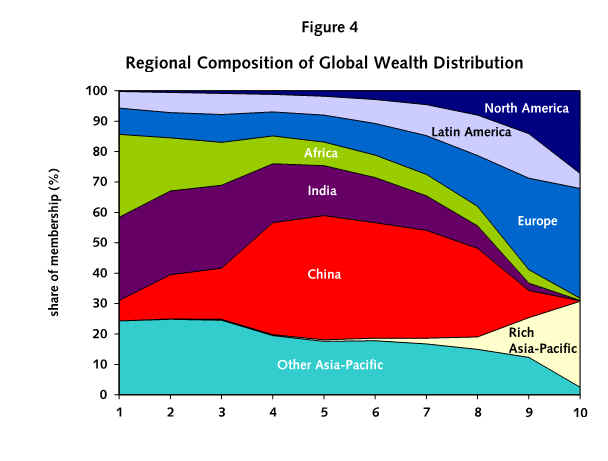
(Figure
4)
China
occupies much of the middle third of the global wealth distribution,
while India, Africa, and low-income Asian countries dominate the
bottom third.
For
all developing regions of the world, the share of population exceeds
the share of global wealth, which in turn exceeds the share of members
of the wealthiest groups. (Figure 3)
A
small number of countries account for most of the wealthiest 10% in
the world. One-quarter are Americans and another 20% are Japanese.
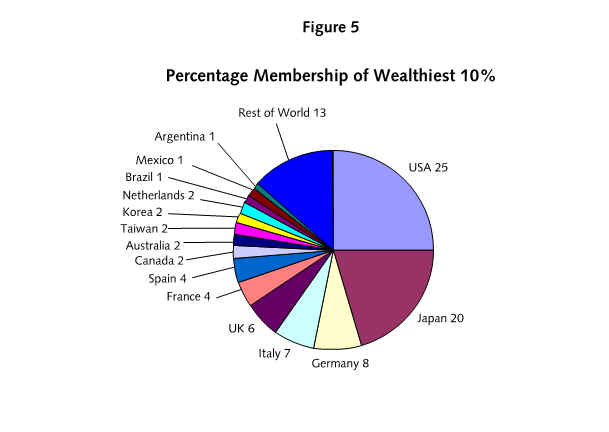 (Figure 5)
These
two countries feature even more strongly among the richest 1% of
individuals in the world, with 37% residing in the USA and 27% in
Japan.
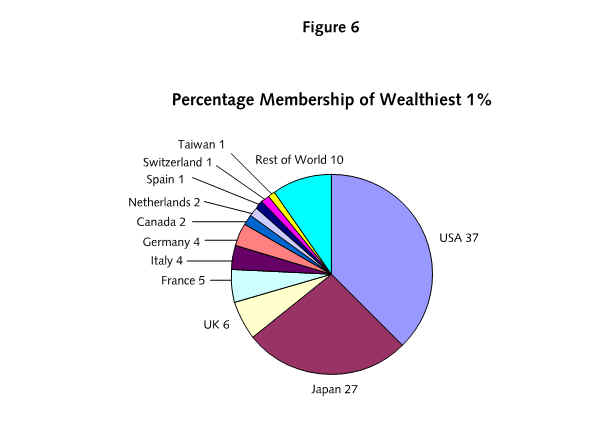
(Figure
6)
According
to Anthony Shorrocks, a countryÆs representation in the rich
personÆs club depends on three factors: the size of the population,
average wealth, and wealth inequality.
æThe
USA and Japan stand outÆ, he says, æbecause they have large
populations and high average wealth. Although Switzerland and
Luxembourg have high average wealth, their populations are small.
China on the other hand fails to feature strongly among the super-rich
because average wealth is modest and wealth is evenly spread by
international standards. However, China is already likely to have more
wealthy residents than our data reveals for the year 2000, and
membership of the super-rich seems set to rise fast in the next
decade.Æ
Composition
of household wealth
The
UNU-WIDER study shows major international differences in the
composition of assets, resulting from different influences on
household behaviour such as market structure, regulation, and cultural
preferences.
Real
property, particularly land and farm assets, are more important in
less developed countries. (Figure 7)
This reflects not only
the greater importance of agriculture, but also immature financial
institutions.
The
study also reveals striking differences in the types of financial
assets owned. Savings accounts feature strongly in transition
economies and in some rich Asian countries, while share-holdings and
other types of financial assets are more evident in rich countries in
the West.
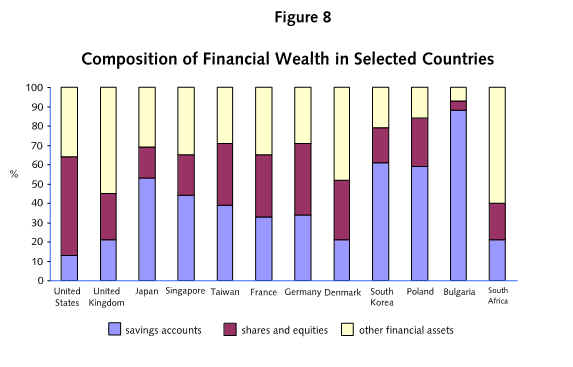
According
to the authors of the UNU-WIDER study, savings accounts tend to be
favoured in Asian countries because æthere appears to be a strong
preference for liquidity and a lack of confidence in financial
markets. Other types of financial assets are more prominent in
countries like the UK and USA which have well developed financial
sectors and which rely heavily on private pensions.Æ
Surprisingly,
household debt is relatively unimportant in poor countries. As the
authors of the study point out: æWhile many poor people in poor
countries are in debt, their debts are relatively small in total. This
is mainly due to the absence of financial institutions that allow
households to incur large mortgage and consumer debts, as is
increasingly the situation in rich countriesÆ
The
authors go on to note that æmany people in high-income countries
have negative net worth andŚsomewhat paradoxicallyŚare among the
poorest people in the world in terms of household wealth.Æ
Authors
of The World Distribution of Household Wealth, December 2006
James
Davies
is a Professor, and the RBC Financial Group Fellow, in the Department
of Economics at the University of Western Ontario. He is the Director
of the UNU-WIDER project on Personal Assets from a Global Perspective.
jdavies@uwo.ca
Susanna
Sandstr÷m
is a Research Associate at UNU-WIDER. She has previously held
positions at the Luxemburg Income Study and Statistics Finland. sandstrom@wider.unu.edu
Anthony
Shorrocks
is the Director of WIDER and has previously held positions at the LSE
and University of Essex. shorrocks@wider.unu.edu
Edward
Wolff
is Professor of Economics, New York University, Senior Scholar, Levy
Economics Institute of Bard College, and Research Associate, National
Bureau of Economic Research. edward.wolff@nyu.edu
To
attend the launch, please register:
In
London:
Francesca
Pompili, Media Services Manager
The
Foreign Press Association
11 Carlton House Terrace
London SW1Y 5AJ
Telephone: +44 (0)20 7930 0445
E-mail: francescapompili@foreign-press.org.uk
In
New York:
United
Nations Secretariat
Press
Room S-226
46 Street & 1 Avenue
New York, NY 10017
Jin Zhang, Programme Assistant
United Nations University office in NY
Telephone: +1-212-963-6387
E-mail: jin@ony.unu.edu
Figures: