Commentary
About the data
Definitions
Data sources
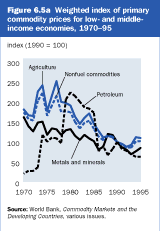
Commodity prices were subject to severe downward pressure during 1980–93 (figure 6.5a). The terms of trade for many developing countries declined as primary commodity prices fell relative to the prices of manufactures (see the notes to table 4.7). More than three-quarters of the decline in nonfuel commodity prices was due to the fall in the prices of agricultural commodities. Part of the explanation for falling commodity prices lies with sluggish demand in industrial countries, especially during the 1980s. But even more important was the sharp increase in the supply of commodities on world markets, which grew four times faster than in the 1970s. Most of this supply increase came from upper-middle-income and high-income countries. Metals prices, for example, were depressed by large exports from countries of the former Soviet Union and Eastern Europe following the collapse of the Soviet bloc.
There is still debate about whether the relative decline in commodity prices is permanent or transitory—or merely the result of mismeasuring quality shifts in manufactured goods. Still, countries that depend on primary commodity exports suffered badly during the 1980s. The declining terms of trade reduced the resources available for investment, slowing growth in real output and per capita income and in many cases complicating already severe adjustment problems. But some developing countries have substantially increased their production and exports of manufactures in the past 30 years, and for these countries the terms of trade have deteriorated less rapidly. Other countries have increased their exports of high-value commodities—cut flowers, shrimp, fruits and vegetables—commodities that have not experienced price declines relative to manufactures over the past 15 years.
About the data
Data on primary commodity prices are collected from a variety of sources, including international study groups, trade journals, newspaper and wire service reports, government market surveys, and commodity exchange spot and near-term forward prices. The most reliable and frequently updated price reports are used. When export prices are unavailable, import prices are used. Annual price series are generally simple averages based on higher-frequency data. The constant price series in the table are deflated using the MUV G-5 index (see below).
The commodity price indexes are calculated as Laspeyres index numbers in which the fixed weights are the 1987–89 export values for low- and middle-income economies, rebased to 1990. Each index represents a fixed basket of commodity exports. The nonfuel commodity price index contains 37 price series for 31 nonfuel commodities. Indexes are compiled separately for petroleum and steel products, which are not included in the nonfuel commodity price index.
The manufactures unit value (MUV) index is a composite index of prices for manufactured exports from the five major (G-5) industrial countries (France, Germany, Japan, the United Kingdom, and the United States) to low- and middle-income economies, valued in U.S. dollars. The index covers products in Standard International Trade Classification (SITC) groups 5–8. To construct the MUV G-5 index, unit value indexes for each country are combined using weights determined by the export share of each country.
• Nonfuel commodities price index covers the 31 nonfuel commodities that make up the agriculture, fertilizer, and metals and minerals indexes; agriculture, in addition to food, beverages, and agricultural raw materials, includes sugar, bananas, beef, and oranges; beverages include cocoa, coffee, and tea; fertilizers include phosphate rock and triple superphosphate (TSP); food includes rice, wheat, maize, sorghum, soybeans, soybean oil, soybean meal, palm oil, coconut oil, and groundnut oil; metals and minerals include aluminum, copper, iron ore, lead, nickel, tin, and zinc; agricultural raw materials include timber (logs and sawnwood), cotton, natural rubber, and tobacco.
• Petroleum price index refers to the average spot price of Brent, Dubai, and West Texas Intermediate crude oil, equally weighted. Steel products price index is the composite price index for eight selected steel products based on quotations f.o.b. (free on board) Japan excluding shipments to China and the United States, weighted by product shares of apparent combined consumption (volume of deliveries) at Germany, Japan, and the United States. MUV G-5 index is the manufactures unit value index for the G-5 country exports to developing countries.
• Commodity prices—for definitions and sources see the World Bank’s Commodity Markets and the Developing Countries or its World Wide Web site on commodities at http://www.worldbank.org/html/ieccp/ieccp.html.
Commodity price data are compiled by the Commodity Policy and Analysis Unit of the World Bank’s International Economics Department. More information can be obtained from the unit’s quarterly publication Commodity Markets and the Developing Countries. The MUV index is constructed by the International Economic Analysis and Prospects Division of the International Economics Department. Monthly updates of commodity prices are available on the Internet at http://www.worldbank.org /html/ieccp/ieccp.html.
top_6Back to top
Back to Contents